Sam Cialek | The Hidden Volatility in Being Well
By Sam Cialek (CAS ’11), Founder of Serif | Email: sam@serif.life
Please note that this blog post assumes basic knowledge of supervised machine learning concepts like linear regression. If you need a refresher on how this works, I think these tried-and-true videos do an incredible job.
Go into the app of your wearable device of choice. Maybe it’s Oura, Apple Health, Whoop, or FitBit. Whatever you use, scroll through the dashboard and the story seems interesting: look at the rings you’ve closed, the steps you’ve climbed, the calories you’ve torched. But behind the smooth trendlines and gamified nudges lies—well, not that much.
For the 850 million wearables users worldwide, they get into these devices for the fundamental reason of improving their wellbeing. Maybe for some that means fixing their intermittent insomnia. For others, addressing the root cause behind why they experience little motivation at work one day each week. But rather than getting actionable advice to mitigate these issues, they instead fill in circles and get pixels in the shape of medals for reaching some arbitrary goal. Their devices keep them in the dark about how to actually address the issues for which they put those devices on their wrists and fingers.
Don’t get me wrong—these gamified trackers are undeniably great. Nudging is a lot. My parents, each in their 70s, haven’t missed their 10k step goal in months and I know that their physical activity would be substantively reduced if it weren’t for these devices. Still, one cannot help but notice the gaping hole between the issue people think they’re solving when they buy one of these devices and what they actually end up addressing.

Why Wearables Can’t Invent the Solution
From the discourse that exists on forums like Reddit (r/ouraring, r/fitbit, r/biohacker to name a few), one might assume that large companies like Apple and Google, as well as more specialized entrants like Oura, are on the case—just one generation away from developing a system that tells users what they need to do to address their sleep or focus or mood problem. And in some ways they are addressing the issue. Recently we’ve seen devices like Oura and Whoop start telling users their optimal bedtime. They also tell people to eat vegetables, stand up, drink water, and all the other advice your grandma gives you every time you call her.
Hardware-free health apps like MyFitnessPal and Flo can go further by letting users see their calorie balance against nutrition goals or flag symptoms that might warrant medical attention.
However, two issues remain salient that keep the software of these apps from being generations away from truly solving the problem at hand:
- They have the wrong business model(1)
- If they’re using AI, it’s the wrong kind
Given the incentive structure around both problems, it’s my belief they will spend the next half decade going deeper down these incorrect paths before digging themselves out.
Bad Statistics
“Fortunate is he who is able to know the causes of things.” – Virgil (29 BC)
Before addressing the problem of AI, let’s examine the traditional statistics that device brands employ. As I mentioned earlier, there are attempts being made by incumbent players to provide some insights to help users make decisions. Since Oura came out with it 3 years ago, all wearables now offer users the ability to find their ideal bedtime. How do they do this? Through a form of pattern matching called univariate linear regression. If you’re not familiar with statistics, this term just means you take an outcome—in this case how well you sleep—and you take an input like your bedtime, graph the two out on a scatterplot, and use a tried-and-true technique called least squares to draw a parabola through those dots. Wherever the parabola is highest—that is at whatever bedtime that curve is showing the highest sleep quality—that’s your ideal bedtime. Easy(2).
The approach feels reasonable until you zoom out and see the whole picture to understand what might interrupt a simple pattern matching analysis. There are many, but the vast majority of imperfection can be explained by these three:
Confounding
A confounder is something that impacts both the variable you can affect and the variable you’re trying to impact. For example, a late bedtime often has hidden companions—late‑night caffeine, blue‑light exposure, stress, alcohol. These factors hurt sleep and push bedtime later. The regression can’t see them, so it blames the clock when the real culprits are elsewhere. Think of it like blaming ice cream sales for drowning deaths when the real culprit is summer heat driving both.
Feature Selection
A model limited to bedtime → sleep quality has no choice but to find a bedtime answer to the question of what affects your sleep quality. Good advice is bounded by the relevance and completeness of the columns you feed the algorithm and that data doesn’t all come from a wearable.
Mediator Blindness
Maybe bedtime isn’t the villain. Maybe what matters is a middle step it triggers. For instance, turning in late usually means more screen time just before sleep. The blue light suppresses melatonin and wrecks sleep quality. If the device tracked that middle link (screen‑time minutes → melatonin dip), it could tell you to cut screens or use blue‑light blockers–a fix that works even if your bedtime stays the same. Because most wearables ignore the mediator, they default to the blunt “go to bed earlier.”
The result: whenever wearables try to employ recommendations, users quickly sense a mismatch, either because what’s being told to them isn’t personalized (eat vegetables, drink water) or is wrong because it’s based on faulty, naive statistics. Notifications get silenced and the ever‑growing torrent of data yields nothing new as users realize devices won’t provide them insight, just data. If wearables are to deliver more than pretty charts, their algorithms must step past pattern matching and start wrestling with causality—otherwise the dashboards will stay bright while the guidance remains dim.
Statistics Beyond Pattern Matching – The Causal AI Revolution
And then there’s AI. One might ask whether the problem of naive statistics might be solved with this newly omnipresent force in our lives. I believe it will. However, the AI that arrives to overcome the failure in generating insights will not be LLMs. Apple and Google specifically, with their 9-figure LLM investments, will reach for this tool as the only one in their AI toolbox. When all you have is a hammer, everything is a nail.
And that is where the usual “just add a larger language model” reflex comes up short. Wearable data are a gold‑mine of signal, but sorting cause from coincidence requires a different lens: causal science. Its first move is to ask a sharper question—If we could rerun the day while changing one habit, what would actually happen?—and then lay out the answer in a directed acyclic graph, or DAG.
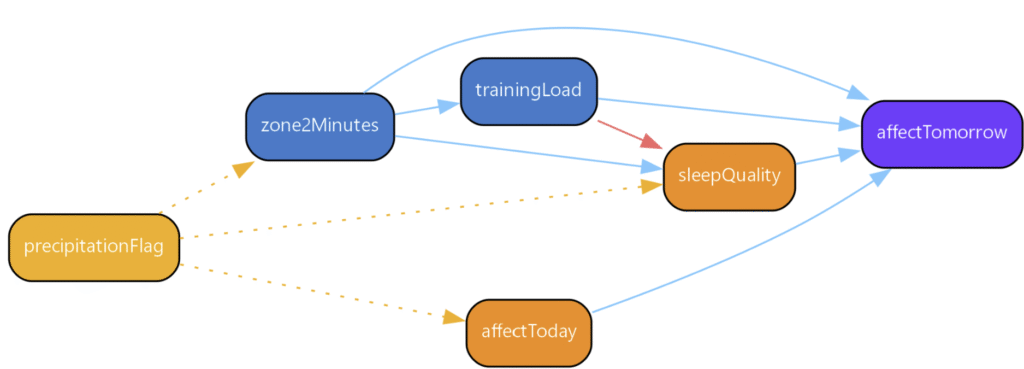
Figure 2 shows a pared‑down DAG built from two years of my own logs. The blue arrows represent direct causal effects, the red arrow shows a negative relationship, and the yellow dotted lines indicate confounding relationships. Let’s trace one path: zone 2 exercise increases training load, which in turn affects sleep quality—but here’s where it gets interesting. Training load has a negative effect on sleep (red arrow), yet zone 2 minutes show a positive effect on affect tomorrow. This suggests that moderate aerobic exercise improves mood through pathways beyond just sleep quality. Meanwhile, precipitation acts as a confounder, reducing both exercise likelihood and mood independently.

Once the map is drawn, the workflow is conceptually simple (though technically demanding):
- List controllable inputs—bedtime, caffeine timing, workout duration, bedroom temperature—alongside target outcomes such as sleep efficiency or afternoon focus.
- Graph the causal links to reveal which arrows run where and where hidden confounders might lurk.
- Estimate each edge’s strength with an ensemble model (XGBoost, neural net, etc.), using modern causal‑inference tricks to control confounding, block mediators, and avoid the traps we just covered.
- Set thresholds and triggers (e.g., zone‑2 minutes help until you hit about 40 per day).
- Update the graph nightly with Bayesian inference, shrinking uncertainty as new data arrive instead of pretending it vanishes.
The result is not another motivational ping but a personalized “what‑if” engine—one that can finally turn all those charts and rings into guidance that actually moves the needle on wellbeing.
See the Difference
If the steps above seemed confusing, don’t worry—the neural architecture that underpins LLMs, the transformer, is something whose innovation may be difficult to appreciate just reading about it in an article, but that makes applications like Claude and ChatGPT no less extraordinary and useful.
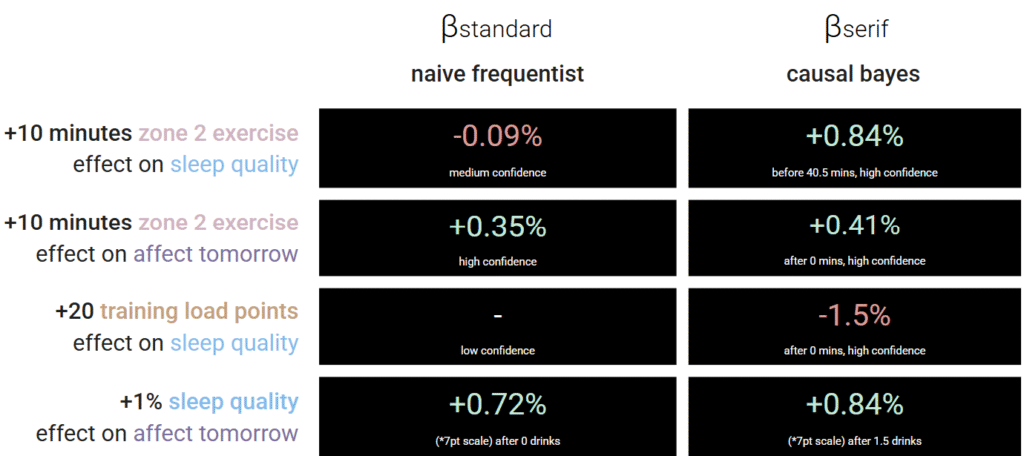
The payoff shows up in Figure 3, a side‑by‑side comparison of naïve slopes and causal‑Bayesian estimates on the same dataset.

In plain English: Traditional analysis says “more cardio = worse sleep” (-0.09%), but causal analysis reveals the truth: up to 40 minutes of zone 2 cardio actually improves sleep (+0.84%) once you account for why people exercise. Similarly, while naive analysis might miss the connection between training load and sleep quality entirely, causal methods detect a clear -1.5% effect per 20 points of training load—crucial information for athletes trying to balance performance and recovery.
Three more examples where causal analysis reveals what correlation misses:
- The Weekend Effect: Figure 1 shows mental clarity tanking on Wednesdays. Naive regression would prescribe mid-week meditation. But the causal graph reveals that Monday’s high training load (from weekend warrior syndrome) creates a delayed sleep debt that manifests 48 hours later. The fix? Moderate your Monday workouts, not add Wednesday wellness routines.
- The Sleep-Mood Paradox: Traditional analysis shows people who sleep 9+ hours report worse moods. The recommendation? Sleep less. But causal analysis reveals these long sleepers are fighting off illness or recovering from stress—the long sleep is the cure, not the cause. The real insight: when you need 9 hours, take them guilt-free.
- The Precipitation Puzzle: Rainy days show lower mood scores, so devices might suggest light therapy. But the causal path shows rain doesn’t directly impact mood—it prevents outdoor exercise, which then affects mood the next day. The actionable insight? On rainy days, prioritize indoor cardio to prevent tomorrow’s mood dip.
These principles now power Serif, a new platform built specifically to bridge this insight gap. Unlike traditional wearables that stop at pattern matching, Serif constructs personalized causal models from your data streams—whether from Oura, Whoop, Apple Health, or manual logs. It’s the difference between being told “you slept poorly” and understanding “your sleep suffered because yesterday’s 60-minute run pushed your training load past your recovery threshold—cap tomorrow’s workout at 30 minutes to reset.”
Three academic lessons emerge:
- Causal graphs expose how mediators and confounders warp raw correlations
- Bayesian updating lets the model learn continuously while preserving uncertainty
- Even modest personal datasets can yield actionable effects when those two ideas combine
The larger point is scientific: pairing causal graphs with Bayesian updating turns the volatility in Figure 1 from an opaque nuisance into a testable, personalized roadmap. That shift promises fewer random push notifications and many more “do‑X, expect‑Y” interventions grounded in evidence rather than hope.
Footnotes
- The business model problem is straightforward: every wearable company protects their hardware moat by siloing data. Since the sensor stacks are nearly identical across devices (PPG for heart rate, accelerometer for movement, thermistor for temperature), companies differentiate through exclusive ecosystems. This means your Oura ring can’t learn from your Peloton’s power output, and your Whoop can’t see your Eight Sleep’s bedroom temperature—artificially limiting the insights any single platform can provide.
- They will back-justify the choice of this time by mentioning your body temperature drop, but ultimately this is downstream what makes that night’s sleep quality measure as being good.

